My First Video – The Plan
By Colin O’ bryan &
Hassan Huntley
This
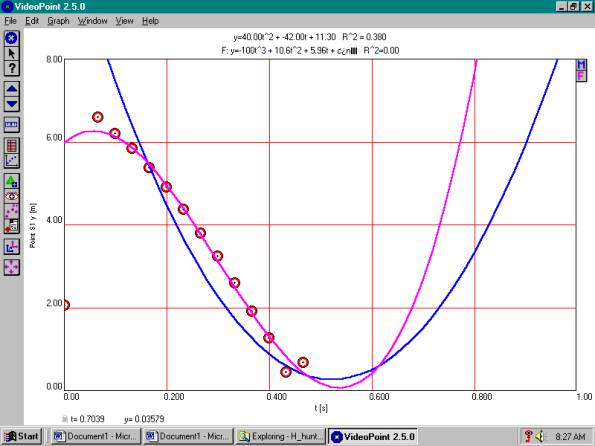
is a graph of the ball while it was falling to the ground.
This
is a Quadratic model of the basketball falling to the ground.
The
independent variable X was (Time measured in Seconds)
The
dependent variable Y was (Height measured in Yards)
Problem: What would happen if the points on the graph where all linear, how different would the graph look and how would it change?
 Answer: The pink line would become vertical which
would make the blue line go off the screen b/c the data would be to big for the
small graph
Answer: The pink line would become vertical which
would make the blue line go off the screen b/c the data would be to big for the
small graph
Video Point was developed by Mark Luetzelschwab, Priscilla Laws
and Michael Gile in conjunction with the Workshop Physics Program at
Dickinson College in Carlisle, PA.
Under the direction of Priscilla Laws, Mark Luetzelschwab developed a
prototype video analysis software program called "2-D Video QT!"
about four years ago. This was a Macintosh-only, Hypercard-based system that
was used in Workshop Physics at Dickinson as well as other colleges and
universities. Video Point was designed based on the feedback generated by
"2-D Video QT!" Totally re-written in C++ for both Macintosh and
Windows computers, Video Point was built to be more flexible and as easy to
use.
Links
http://edservices.aea7.k12.ia.us/edtech/teacherpages/jmbrown/
http://www.exploratorium.edu/snacks/parabolas.html
http://www.mste.uiuc.edu/dildine/sketches/parabola.htm
http://www.mste.uiuc.edu/dildine/sketches/parabolas.htm
http://www.krellinst.org/UCES/archive/resources/conics/node52.html
http://library.thinkquest.org/10030/6conicpa.htm
This web page was created by Hassan Huntley & Colin O’ bryan
and we are both juniors at Fayetteville High School
you can email Hassan at Hassan4_@Hotmail.com
and you can email
Colin at M_O’BRYAN@fayar.net