Linear Bubble Baby
By: Kyle Druding
NN AX+BNN
AX+BNN AX+BNN
AX+BNN AX+BNN
AX+BNN
This web page is designed to show
you how to correctly and quickly use the bubble baby y= function on your
TI calculator. Up until this year I have never utilized my calculator to
its fullest because I never knew how to use all the different keys. Throughout
the year we have probably used this function the most out of any other.
There are a few simple steps you have to lean in order to use the Bubble
Baby successfully.
-
First of all, you have to know the
formula for a linear line. If you have the wrong formula it is very hard
to get a good fit with your Bubble Baby. The formula is AX+B.
-
Then you need to enter in values
for the A and B. A good starting number is A=1 and B=0. If you think a
different number will be more successful try that instead. Once you enter
a value you will be able to see if you are on the right track. Then you
can adjust the numbers to fit the curve perfectly.
-
Another factor that can make it easier
to fit the curve is the window. You want to look at your data you are using
and see what the highest and lowest numbers are.
-
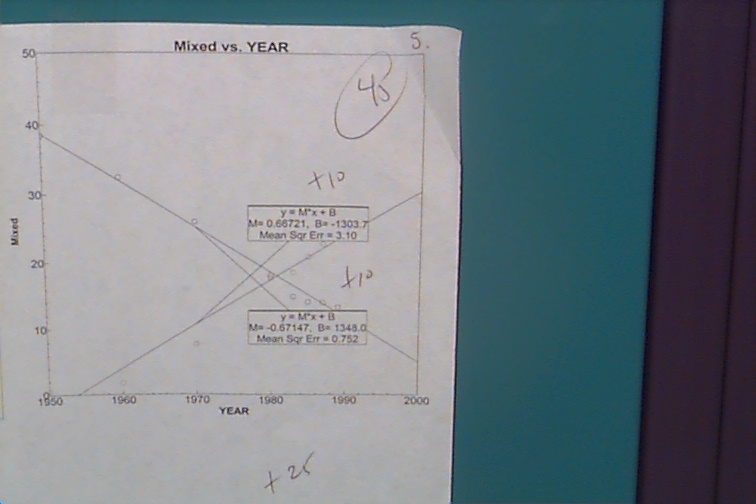
Below is a sample problem completely
worked out.
-
Given the following data set showing the Percent of Homes in the U. S.
Heated with Electricity and Oil , answer these questions.
a) Make a Scatter Plot of both Oil and Electricity as a function of
the Year.
b) Get an equation for each line.
c) Predict: the percent of homes heating with oil in 1975, heating
with electricity in
1990; and heating with oil in 2000.
d) When where the percentages equal?
|
Year
|
Electricity
|
Oil
|
|
1950
|
38.5
|
0.6
|
|
1960
|
32.4
|
1.8
|
|
1970
|
26.0
|
7.7
|
|
1980
|
18.1
|
17.7
|
|
1983
|
14.9
|
18.5
|
|
1985
|
14.1
|
20.8
|
|
1987
|
14.0
|
22.7
|
|
1989
|
13.3
|
24.6
|
|
1991
|
12.3
|
25.5
|
-
After you are given the data you have
to get all the lists entered into your calculator. Then you enter in the
equation for y =.
-
A good starting point is M=1, B=0. Then
from there you can see where you need to move you line. M moves the equation
up and down and B is the slant. You may have to use decimals to reach you
destination.
-
After you feel you have a line that
fits you can document it by sketching the graph or printing it out.
This page has been contributed
by Kyle Druding a Jr. at FHS, for further information you can contact Mr.
Young at dyoung@prodigy.net
or myself at k_druding@fayar.net.
-
Here are some sites that can be very
helpful for further references.
The Data
and Story Library
FASST web page
Ti Calculator web page
Math
Department
Here are some other sites that I find helpful or
entertaining that you may want to check out.
Jokes
Typed Reports for School