Quadratics from the Web
Algebra 1
In this investigation, your goal will be to find some "real"
data from the "Dazzle" that you think forms a Quadratic Model, and place that
data into Graphical Analysis or Excel. Once that data is in the selected APP you will have
the Quadratic Model produced and reported. Make sure you identify the data set you
selected.
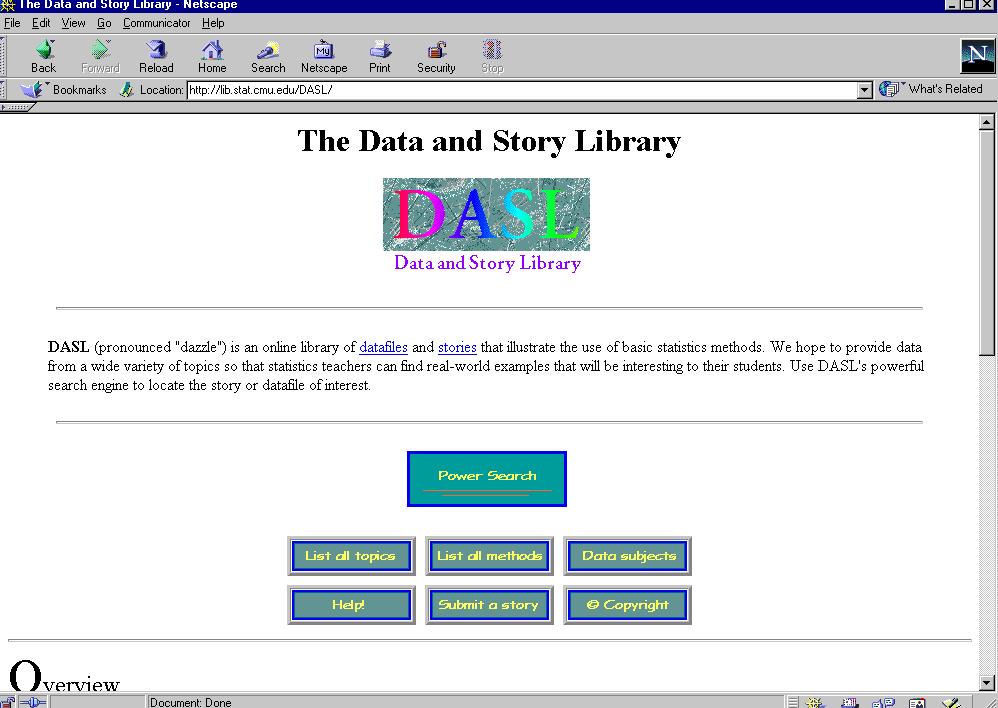
1. Go to the Data and Story Library site linked on the Algebra web page.
2. Find a set of data that interest you by selecting the button of choice off of the main
page.

3. If you think this data (two sets, X and Y) might model a Quadratic,
move the data to either Excel or Graphical Analysis.
4. Document the data set with the names of the X values and the names of the Y value
(units) and explain what the data represents.
5. Have the application calculate the Quadratic model for the data. Report this equation.
6. State if you still believe this is a Quadratic and why.
7. Print the product from Excel or Graphical Analysis, or attach it to an email to me.
Make sure you include the Big 4 (name, date, period, and what it is).