Alternatnatively, you can fit the data automatically. If you installed without the curve fitting, you can move on to the next section.

- To fit the velocity versus time data, click once on the velocity plot (the time labels should move back down to the bottom of the window).
- Then choose Graph->Add/Edit Fit or click on the
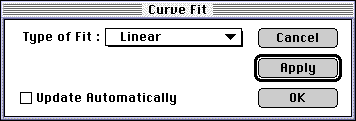
 icon. The Following dialog should appear.

Curve fitting dialog
- Leave the "Type of Fit:" set to "Linear". If you want VideoPoint to update the fit every time that you move a point on the movie, check the "Update Automatically" box; otherwise, you can update the fit by opening this dialog and choosing "OK" or "Apply" later.
- For this example, check the box and click on "OK".
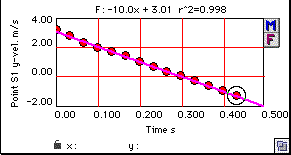
The fit of the velocity plot should appear and look something like this:

Fit of y component of velocity vs. time.
As you might expect, the slope of this line should be approximately -9.8, since this can be modeled by the equation V = V0 + at.