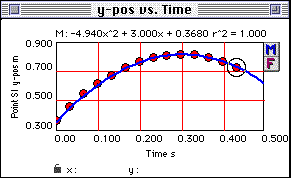
Since many of the motions of interest in the study of physics can be described by analytic functions, Video Point has a graphical modeling feature that enables you to try to develop a mathematical model for a motion. You can do this by comparing a graph of the motion to a graph of an equation. For example, in analyzing a movie of a bungee jumper in free fall, you could select a graph of the experimentally determined values of y vs. t. Then you could choose to model the data with a quadratic equation and then match the parabolic line to the data by changing values of the equation coefficients. Is the coefficient of the t2 term close to 4.9 m/s2?


Model of y vs. time for the ball toss. Note that this is a model and not a fit. To complete a model efficiently, a user must understand how to recognize the type of function that is needed and how each of the equation parameters affects the mathematical function. Note the Model Equation dialog box that follows.
How to Create a Mathematical Model
- To model Y vs. Time for the projectile, click on the graph to bring it to the front. The time lables should move up to the rest just underneath the position vs. time plot. Then choose Graph->Add /Edit Model. This will bring up the following dialog box.

The Modeling Dialog Box.
- Since Y vs. Time is a parabola for this projectile, choose the "Quadratic" formula.
- Enter appropriate values in each box that correspond to the constants in the equation.
- Click on "Apply" to view your modeled graph (shown as a green line) without closing the dialog box.
- Once you are satisfied with your model, click "OK" to close the dialog box.
If you entered A:=4.94, B:=3.00, and C:=0.368, your model should look something like this:

A Graph Window shows data points and the line that is a graphical representation of mathematical model of the data.
The constant A (for the x2 term) should be approximately -4.9 since this is a projectile, which can be modelled by the equation
y = 1/2 gt2 + vot + yo