- Set your movie back to a normal size by choosing Movie->Normal Size or typing the keyboard shortcuts of Command-1 (Mac) or F6 (WIN).
- To graph the data that you have collected, click on the graph icon
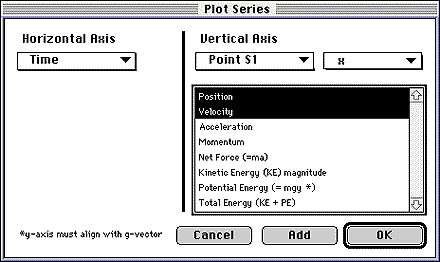
 in the toolbar or choose View->New Graph (Ctrl-G) from the menu bar. The following dialog box will appear.

- Leave the horizontal axis at its default setting of "Time". For the vertical axis, choose "Point S1" and "y" from the two pop-up menus, and then select position and velocity from the list.
- You can select multiple items by simply clicking on them. Clicking on a selected item in the list deselects it.
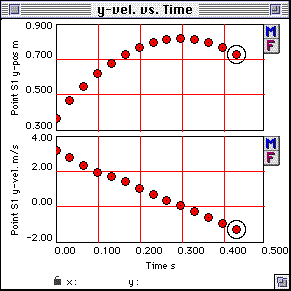
This will plot both position vs. time and velocity vs. time in the same window on two separate graphs. The plot should look something like this:

- Repeat the graph process for an X vs. Time plot for Point s1.