![]()
To give you some idea of the analysis that you can perform using VideoPoint, some screen shots are given here. Click on the thumbnail image to display the full image.
- Projectile Motion
- Rotational Motion
- Setting up VideoPoint so Your Students Don't Have To
- Electrostatics
- Oscillations
- Oscillation (Phase Plot)
- Interesting Collision
- Conservation of Energy
- Conservation of Momentum
- Multiple-Object Collision

Rotational Motion

Analysis of the Cyclops ride at Hersheypark in Hershey, PA. A point on the spinning wheel is followed around for a little more than one rotation. After moving the origin to the center of the wheel, the x position and angular position (theta) are plotted against time.
Modelling the cosine of the x position plot is easy once the line has been fit to the angular position. The frequency term is the slope of the line and the phase shift is the y-intercept. The only value that needs to be estimated is the amplitude.
Note that the model is not perfect and that the line is not entirely straight. This is because the movie was taken from the ground, the wheel will look like it is spinning faster at the top of the wheel than at the bottom of the wheel. Also, the wheel is at a slight angle to the vertical.
Setting up VideoPoint so Your Students Don't Have To
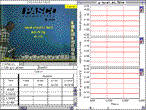
 If you want to make the analysis easier for your students, you can set up VideoPoint so that it opens up a blank file such that the student only needs to follow the object on the screen. In the one shown here, the scale has already been done and graphed for position, velocity and acceleration will fill in as data is taken.
This file is available on your hard drive after installation; it's titled "blank.vpt".
Electrostatics
 This situation has two charged balls; one in the center hangs from a long string, the second is on a fixed (neutral) rod and brought slowly towards the hanging ball. Position data is collected for each ball and a distance calculation is made. After moving the origin such that the x-position of the hanging ball is 0 initially (when the balls are far enough apart that the force is negligible), the x-displacement of the ball (which is proportional to the force exerted on it) is plotted against the distance between the two balls. As you might expect, since the force exerted on the charged ball is inversely proportional to the square of the distance between the two balls, the x-displacement vs. distance plot can be modelled by a squared term.
Oscillations
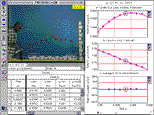
 A PASCO cart (wonderful tools in video analysis... they have very low friction and are easy to see) is attached to a spring and rests on an inclined track. After being given some initial displacement down the track, the cart oscillates, slowly losing energy due to friction. The origin is moved to the height of the track and rotated such that movement in the y direction can be ignored. The x-position vs. time is plotted and modelled using an equation that is simply typed into the modeling dialog.
Oscillations (Phase Plot)
 This is the same situation as before, but demonstrates a phase plot of position vs. velocity. Lines on the graph help display the spiraling nature of the graph.
Interesting Collision
 A cart is collided with a two-cart system (the two carts are connected to each other by a simple metal loop that acts as a spring). The position of the singular cart is plotted as well as the position of each of the two carts. Note that the position of each cart is actually plotted against the center of mass of the two cart system; plotting them against the fixed coordinate system causes them to oscillate around a sloped line.
Conservation of Energy
 A falling mass pulls a cart up an incline. The total energy of the system (calculated from the position of the center of mass of the two objects) is plotted along with the total energy of each object. Note that the cart, starting from rest, gains both potential and kinetic energy as it climbs the hill while the falling mass gains kinetic but loses potential energy while falling.
Conservation of Momentum
 The exploding cart experiment shows conservation of momentum. Two carts spontaneously separate from each other. The momentum of each cart is measured. Even though the mass of the cart on the right is twice the mass of the cart on the left, the momenta are approximately equal and opposite.
Multi-Object Collision (Pool Break)
 Is momentum conserved in a pool break? The momentum of the center of mass of this system (calculated by taking the locations and masses of each ball in the break) is plotted over time. As you might expect, momentum does not look to be conserved. Watching the movie (and thinking about pool breaks) shows you that the balls are slowing down and even coming to a stop in the short time period that is captured on the movie.